
China - A Hidden Reality
Sizing the Losses Hidden Inside the Chinese Banking System

Before anything else, a thank you.
This paper was first published a week ago on the Santiago Capital blog, at the invitation of my good friend Brent Johnson. I met Brent about ten years ago, and over that time, he has become not just a voice I respect enormously but a close friend. He has a rare combination: the conviction to hold a strong view and the intellectual honesty to pressure test it, his own included. He reads widely, thinks independently, and never mistakes consensus for truth. The introduction he wrote for the paper was far more generous than I deserve. Thank you, Brent. For the platform, for the friendship, and for always asking hard questions.
Since the paper went out to his readers, I have received a steady stream of messages and questions about it. Brent’s publication sits behind his paywall, so with his blessing, I am now making the full paper available here, free, for anyone who wants to read it. If you want to follow his work, and I strongly suggest you do, here is the link:

Why I wrote this paper
Start with one question.
If the largest property crash in modern history is unfolding inside the largest banking system on the planet, why do the official numbers show almost nothing?
Hold that question in your mind while you read three facts.
Real residential property prices in China ended 2025 at their lowest level in 20 years, down roughly 23% in real terms from the 2021 peak. New home prices have now fallen for 35 consecutive months, the longest streak ever recorded. Somewhere between 65 and 80 million homes stand empty or unsold, enough to house the population of a large country.
And yet Chinese banks report a nonperforming loan ratio of 1.52%. Essentially unchanged from before the bust began. No property crash anywhere, at any time, has ever produced a number like that. The United States peaked at 5.6%. Spain at 13.6%. Ireland above 25%.
Either China has discovered a way to crash a property market without producing bad loans, or the losses are there and simply have not been recognized. This paper measures which one it is.
I have spent more than a decade analyzing China, and this is the most complete piece of work I have produced on it: a full reconstruction of the Chinese banking system, built bottom up from public data, with every assumption stated and every source linked.
Adding up the property complex, local government debt, the core loan book, the regional banks, wealth and trust products, insurance, Belt and Road lending, and the unrealized losses buried in bond books, the total estimated economic loss lands at roughly $3.86 tn in the best case, $7.68 tn in the base case, and $12.20 tn in the worst case.
The Consolidated Loss Table
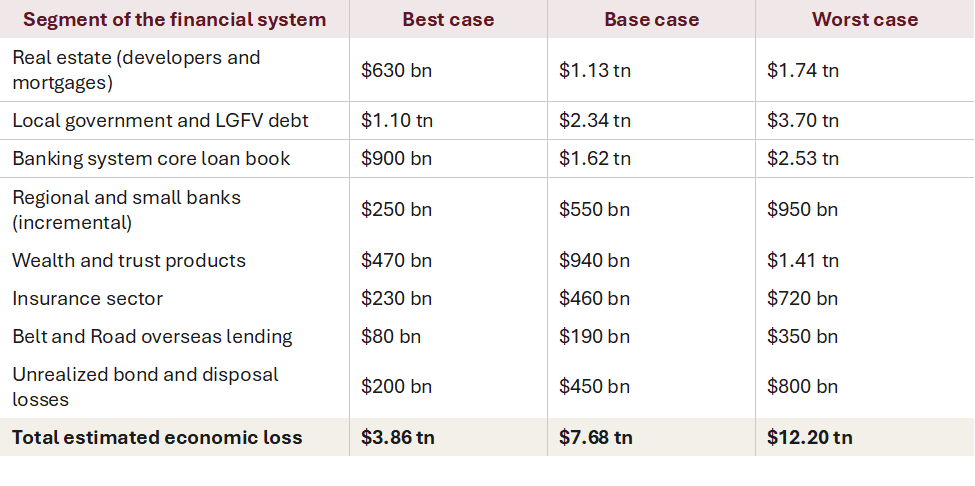
China officially discloses $520 bn in bad loans. The base case is roughly 15 times that figure.
To be clear, this is not a prediction of collapse. The Chinese state has tools other economies lack, and the most likely path is a slow, Japanese style workout rather than a Lehman style rupture. The purpose of the paper is to measure the gap between what is reported and what global precedent says should already be visible.
That gap is the story.
As always, I have laid out the facts as I see them, shown my work, and left the conclusions to you. If you find it worth your time, send it to the person you talk to about China. This is a conversation worth having with the numbers on the table.
The full paper is below.
